In this blog post, we will learn the steps to visualize terraform config using Graphviz. terraform graph command is utilized to generate a visual representation of either a configuration or an execution plan. This command produces a DOT format output.
We will explore how to generate an image which would be a graphical representation of terraform resources and their dependencies using the DOT file we will generate. To achieve this, we will use Graphviz, an open-source graph visualization software.
I won’t get into the details of the Terraform code, assuming you already have a main.tf file along with other terraform code written in configuration files. As an example, I am using the following terraform configuration file.
Sample-main.tf
terraform {
  required_version = ">= 0.15"
  required_providers {
    local = {
      source  = "hashicorp/local"
      version = "~> 2.0"
    }
  }
}
resource "local_file" "Myfile" {
  filename = "techpress_test.txt"
  content  = <<-EOT
    Lorem Ipsum is simply dummy text of the printing and typesetting industry.
    only five centuries, but also the leap into electronic typesetting, remaining
    essentially unchanged. It was popularised in the 1960s with the release
    iece of classical Latin literature years old. Richard McClintock a Latin professor
    Virginia, looked up one of the more obscure Latin.
    EOT
}
Terraform Initialize
- Initialize the Terraform Plugin first using
terraform init.
terraform init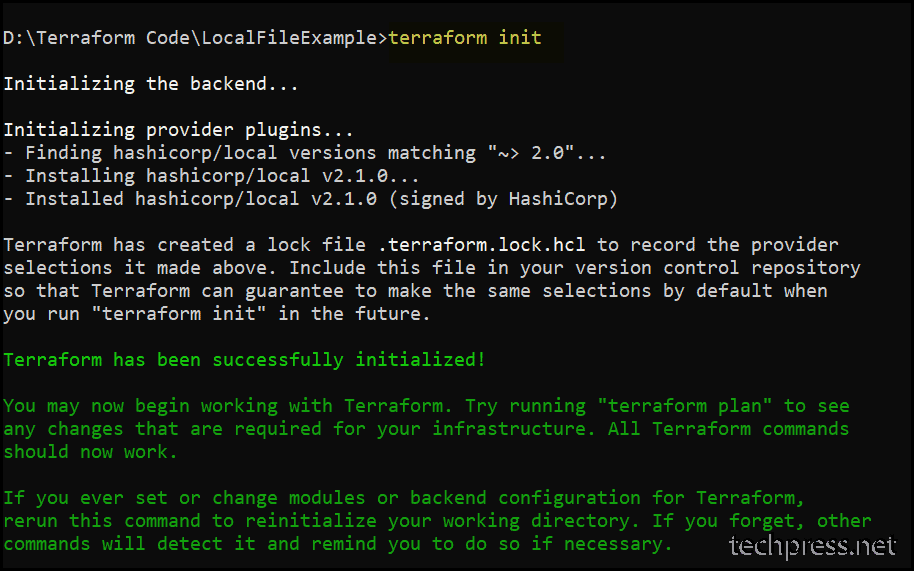
Terraform Graph Command
Use below command to generate a DOT file.
terraform graph > graph.dot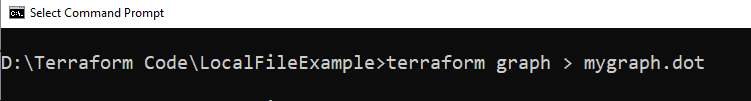
As we have executed the command from D:\Terraform Code\LocalFileExample prompt, the .dot file will be generated in the same folder. Check your command prompt and go to the location to find the generated dot file. The file name would be mygraph.dot.
Install GraphViz Tool on a Windows PC
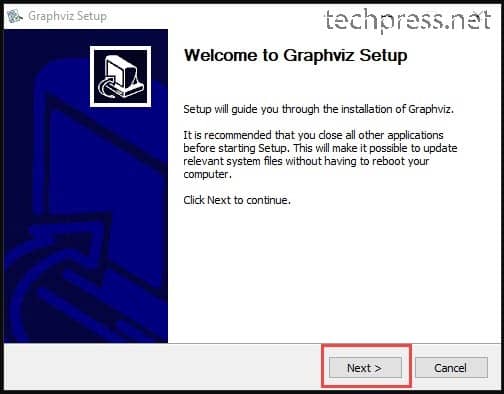
Download and Install GraphViz tool on a Windows device. Installation is straightforward, following a simple wizard. Let’s take a look:
- Launch Graphwiz Setup and click on Next.
- Click on I Agree.
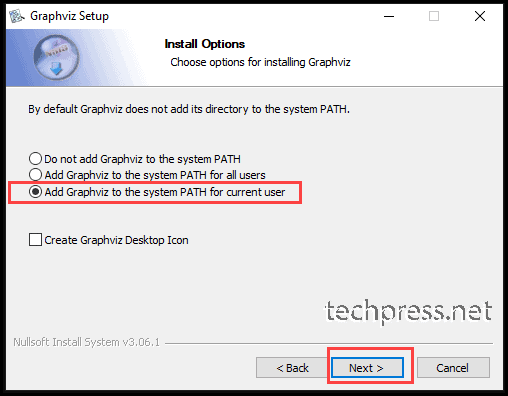
- Select Add Graphwiz to the system PATH for current user. Click Next.
- Click Next.
- Click Install.
Once Graphviz is installed, close and reopen the command prompt window so that the environment PATH variables added by the installation can be picked up by the console.
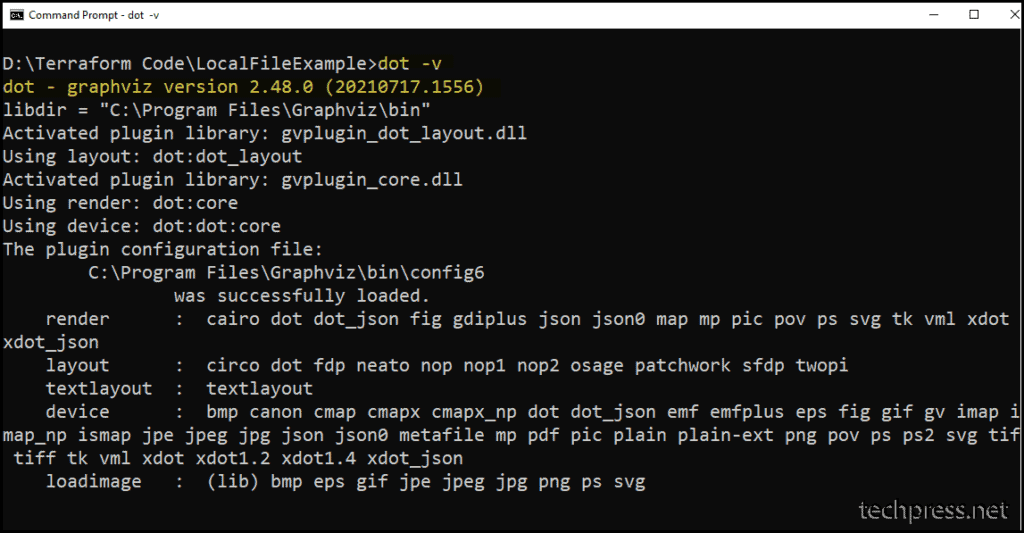
Test Graphviz installation
To confirm if Graphviz has been installed and is working fine, open the command prompt and run the dot -v command. If it returns the output and shows the version along with other information, then it’s installed successfully.
Convert DOT file to SVG Image
Graphviz supports various output formats that you can utilize for converting a DOT file. I will be using the SVG format. Once the DOT file is converted to SVG format, it can be opened in any Internet browser.
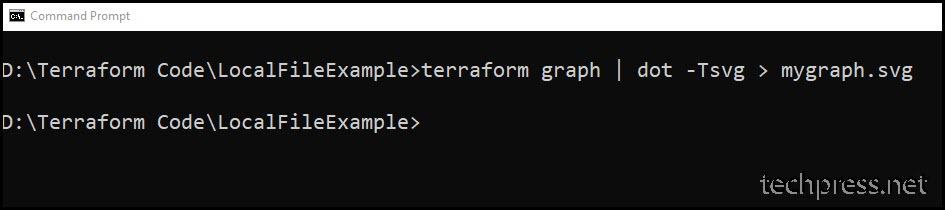
I am providing two commands that can be used to convert a DOT file to SVG. Either of the commands can be used. The first command is suitable when you have already run the terraform graph command and generated the mygraph.dot file.
dot -Tsvg mygraph.dot -o mygraph1.svgThe following command uses terraform graph and the output is piped to the dot command, basically generating the DOT format and converting it to mygraph.svg. In this case, a DOT file is not created separately.
terraform graph | dot -Tsvg > mygraph.svgmygraph.svg file will be generated at the command prompt location which in our case is D:\Terraform Code\LocalFileExample.
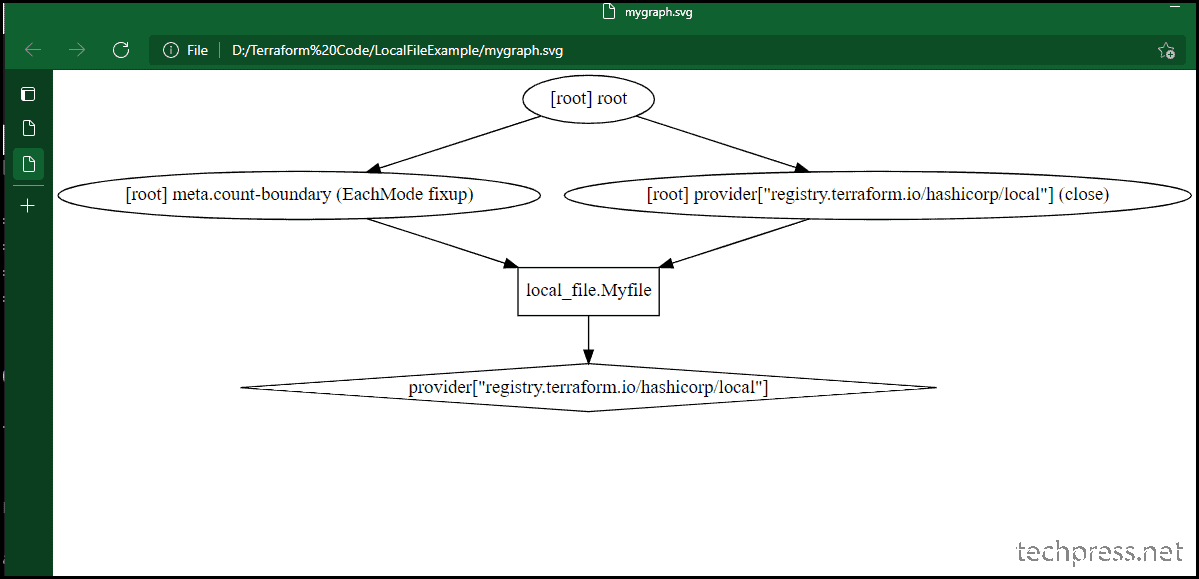
Open the SVG File
You can open the SVG file using any internet browser, which will display all the resource nodes and dependencies between resources in a graphical format.