In this blog post, I will demonstrate how to generate System performance report on Windows 11 computer. This report will include information about CPU, Network, Disk, Memory, and other diagnostic system information which will be helpful for troubleshooting purposes. I will be using Performance monitor tool to complete this task.
Performance Monitor (also known as PerfMon) is a built-in Windows tool used to track and analyze system performance in real time or via logs. It helps monitor metrics like CPU, memory, disk, and network usage through customizable counters. This tool has been around since Windows NT 3.1, released in 1993, making it over 30 years old. Despite its age, it remains a powerful utility for troubleshooting and performance tuning.
Contents
Steps to Generate System Performance Report
Let’s get to the steps to generate System performance report on a Windows 11 device.
1. Open Performance Monitor
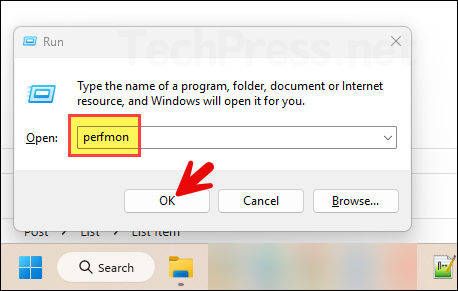
- Press Win + R keys together to open the Run dialog box.
- Type perfmon and press Enter to open the Performance monitor console. (Alternatively open it from Start menu by searching for Performance Monitor tool).
2. Start System Performance Report
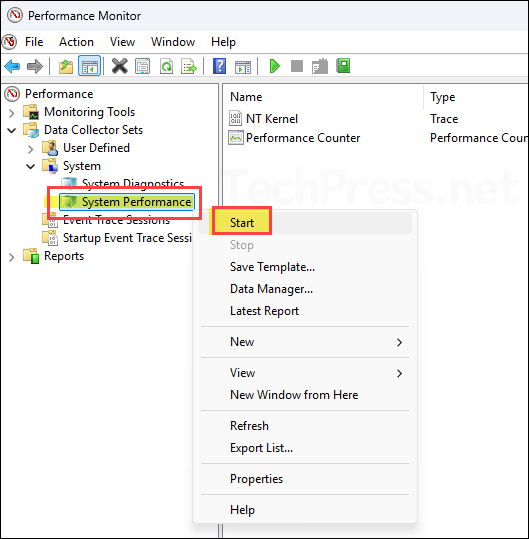
- Navigate to Data Collector Sets > System > System Performance. Right-click on it and click on Start. By default, the report will run for 60 seconds and stops automatically.
Alternatively, Open PowerShell console (as admin) and run logman start ‘System\System Performance’ command to start System Performance report.
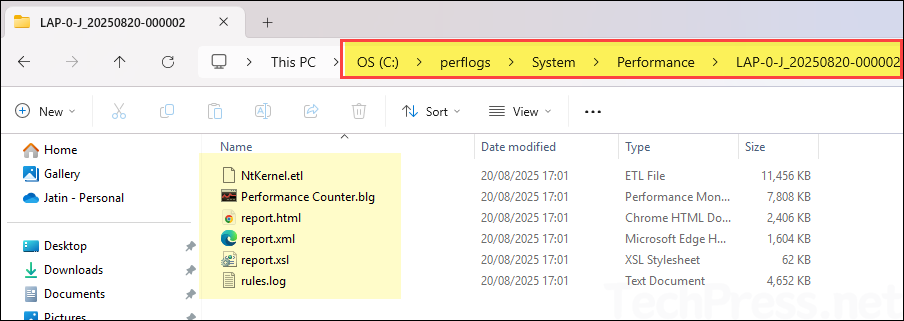
- Locate the files at C:\PerfLogs\Admin\System Performance. Open the folder with the latest date/time stamp to find the most recent System Performance report. You can open report.html or report.xml, but the best way to review it is in the Performance Monitor console (see next).
3. View System Performance Report
- Press Win + R keys together to open the Run dialog box.
- Type perfmon and press Enter to open the Performance monitor console.
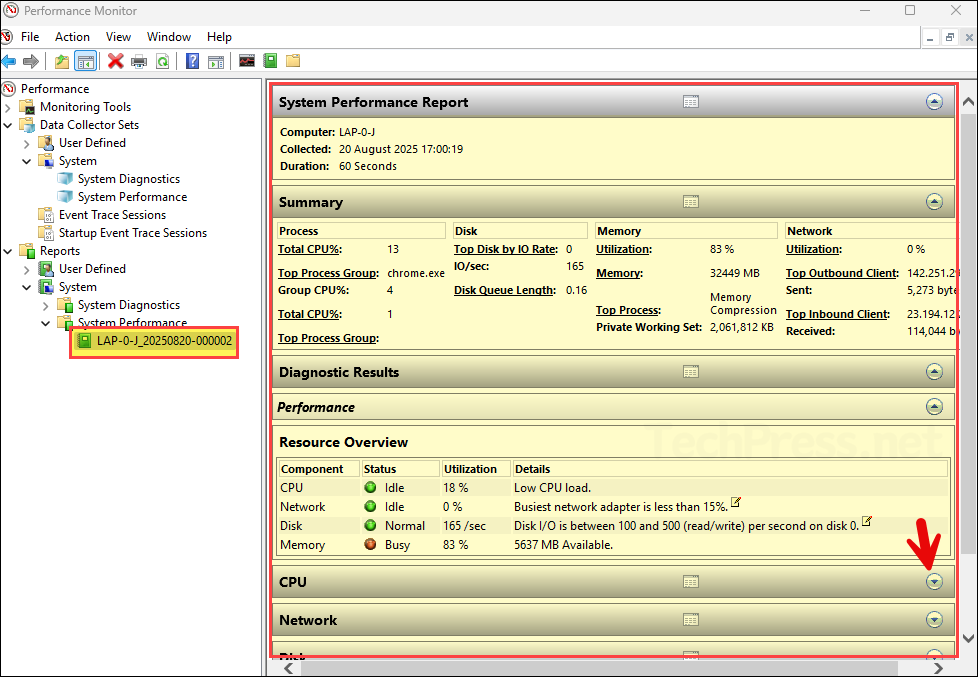
- Navigate to Reports > System Performance. You will find all the system performance reports under this folder. Click on the latest report to view its information on the right-hand side.
4. Export System Performance Report
You can not just view the system performance report in the perfmon tool, but you can also export it to a PDF file for sharing it with your IT administrator. IT admin can then use this report to troubleshoot a specific system issue. Let’s see how to export it to a PDF file.
- Press Win + R keys together to open the Run dialog box.
- Type perfmon and press Enter to open the Performance monitor console.
- Navigate to Reports > System Performance. Expand all the sections you want to show in the report by using the arrow button on the right.
- Right-click on the report and click on Print.
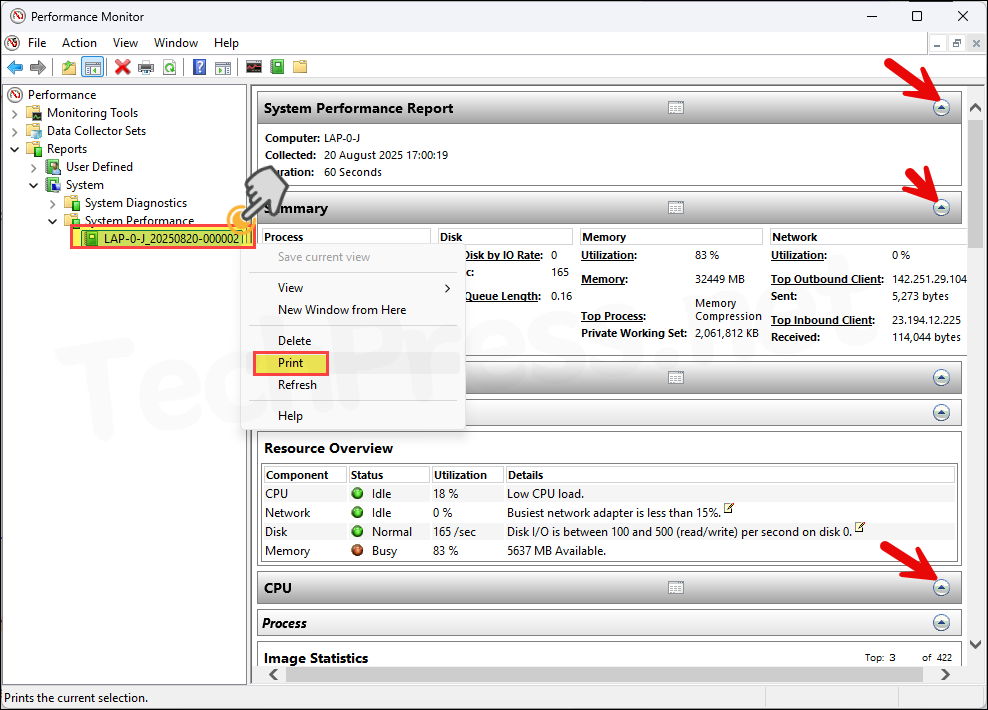
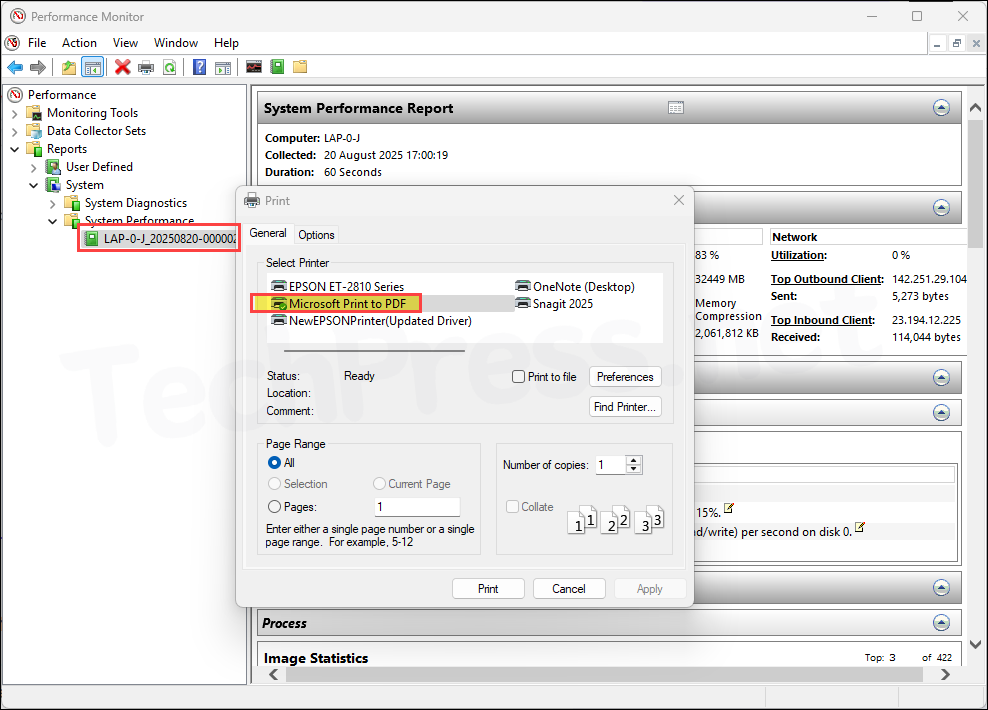
- Select Microsoft Print to PDF printer and click Print. It will save the report in PDF format.
What’s Included in the System Performance Report
Below is an overview of what is included in the System Performance report.
- At-a-glance Resource Overview
- One-screen health summary for CPU, Disk, Memory, and Network with status indicators.
- Quick identification of the current issues (if any).
- CPU (Processor)
- Overall CPU utilization (e.g., % Processor Time) and responsiveness indicators.
- Per-process CPU consumers (top offenders).
- Processor queue/ready indications and kernel activity (interrupts/DPCs) highlights.
- Disk (Storage I/O)
- Disk throughput and latency indicators (e.g., Transfers/sec, average seconds/read & write).
- Queue length/saturation signals.
- Per-process highest disk I/O contributors (reads/writes and bytes).
- Memory
- Available MB, Committed bytes vs. Commit limit (pressure).
- Hard faults/sec (paging activity).
- Working set/private bytes for top memory-consuming processes.
- Paged/Non-paged pool usage overview.
- Network
- Per-adapter throughput (bytes/sec) and packet rates.
- Retransmits/errors indicators (TCP health).
- Per-process top network I/O talkers (send/receive).
- Processes (Top Lists)
- Consolidated “Top N” processes by CPU, Disk I/O, Memory, and Network so you can quickly pinpoint heavy users.
- Report Statistics / Run Info
- Start/stop time, total duration, and a summary of the collectors used.
- Links to the underlying performance counter logs for deeper analysis.
- Findings & Notes (if applicable)
- Contextual notes when a resource is under stress (e.g., CPU or disk flagged as the likely issue).
- Pointers that help you decide where to investigate next (specific counters or processes).
How to Troubleshoot using System Performance Report
- Run System Performance during the issue (e.g., slowdown or system crash, etc.)
- Open the report and check the Resource Overview for any issues (CPU/Disk/Memory/Network).
- Jump to the Top Processes list for that resource to identify the culprit.
- Correlate with detailed counters (e.g., disk latency vs. queue) to confirm cause.
- Drill into the process (version, path, services) outside the report if remediation is needed.
Windows 11 System Performance Report | Checklist
Use this checklist to capture, read, and act on a System Performance report quickly during a slowdown.
1) Capture the report (60 seconds)
GUI (PerfMon):
- Press Win+R >
perfmon> Ctrl+Shift+Enter (run as admin). - Data Collector Sets > System > System Performance > right‑click Start.
- Reproduce the issue for ~1–2 minutes. Report will automatically stop.
System Performance Report Generation Command Line
logman start "System Performance"
REM reproduce issue ~60–120s
logman stop "System Performance"
Open the report:
- Reports > System > System Performance > open the latest time‑stamped item.
- Files are also under: C:\PerfLogs\Admin\System Performance\ (per run folder).
2) Read the report in order
- Resource Overview (top): Which light is red/amber? CPU / Disk / Memory / Network.
- Top Processes: Note the top offenders for the flagged resource.
- Details: Confirm with the relevant counters below.
3) Drill‑downs & What to do
CPU bottleneck
Signs: High % Processor Time, sustained ready/queue, high DPC/ISR.
Counters to confirm: % Processor Time, Processor Queue Length, DPCs Queued/sec, Interrupts/sec.
Top‑process clues: A single process at high CPU or many normal processes adding up.
Immediate actions:
- End or throttle rogue process; check updates/driver loops.
- If DPC/ISR heavy > suspect drivers (NIC/storage). Update or disable offending device temporarily.
Disk (storage) bottleneck
Signs: Slow app/UI, high disk active time, long IO waits.
Counters to confirm: Avg. Disk sec/Read|Write, Disk Transfers/sec, Current Disk Queue Length.
Top‑process clues: Process with very high reads/writes or bytes/sec.
Immediate actions:
- Pause background scans/indexing/backup.
- Free space; check SMART; move workload; verify controller/firmware.
Memory bottleneck
Signs: Low Available MB, rising Commit, high Hard Faults/sec.
Counters to confirm: Available MBytes, Committed Bytes, Commit Limit, Pages/sec, Page Reads/sec.
Top‑process clues: One process with huge Working Set/Private Bytes.
Immediate actions:
- Close/restart leaky app/service; reduce concurrency; increase RAM if chronic.
Network bottleneck
Signs: High adapter throughput, errors/retransmits, latency spikes.
Counters to confirm: Bytes Total/sec, Packets/sec, Packets Outbound Errors, Segments Retransmitted/sec.
Top‑process clues: Process with large send/receive rates.
Immediate actions:
- Check switch/driver/duplex; disable large‑send offload if suspected; test wired vs. Wi‑Fi.
4) Quick triage sequence
- Identify issue from Resource Overview.
- Name the culprit from Top Processes.
- Validate with counters (latency/queue/committed bytes/retransmits).
- Apply a safe immediate action (restart app/service; pause scans; update/rollback driver).
- Re‑test; capture another 60s report if needed.
5) Save/Share
- Go to Export System Performance Report section in this post to export the report to PDF.
System Performance Report Generation One-Liners
- Open command prompt as an administrator and execute below commands as per their comment.
One-liners
REM Open PerfMon directly as admin
start /b perfmon

REM List active data collector sets
logman query -ets

REM Start System Performance data collector without saving data collector set
logman start "System Performance"

REM Stop a stuck collector
logman stop "System Performance"